

N-of-N Tutorial
This page provides a step-by-step tutorial for using the N-of-N Iterations wizard. You will learn how to set up N-of-N hierarchies, run an N-of-N query and view the grid results using different visualization types.
NOTE: For an overview of the N-of-N feature and a brief usage scenario, see N-of-N Iterations.
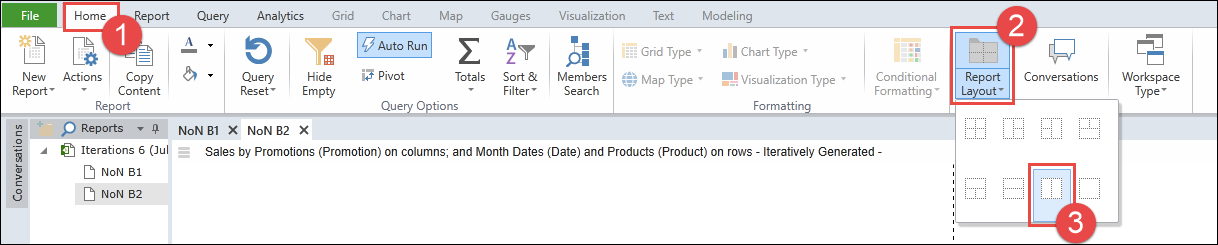
STEP 1 - Report Layout
- We open the Data Discovery/Home ribbon.
- We click the Report Layout icon.
- We select the "two vertical panes" layout as shown below.
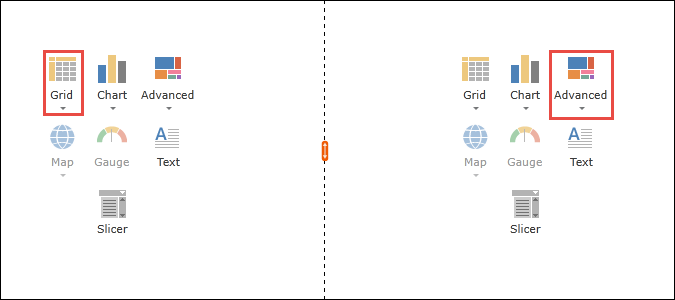
STEP 2 - Report Components (Grid & Advanced)
We choose Grid and Advanced as our Report Components.
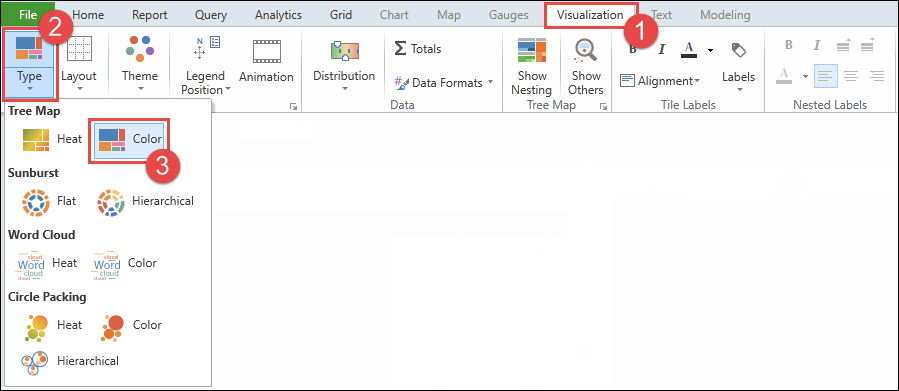
STEP 3 - Visualization Type
- We open the Data Discovery/Visualization ribbon.
- We click the Type icon to choose a Visualization type.
- We select the Tree Map/Color type because it is well suited for displaying iteration results.
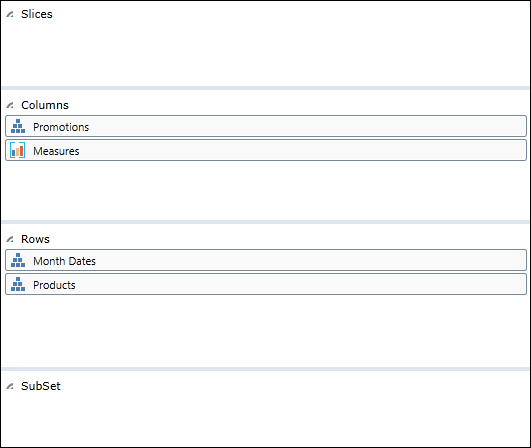
STEP 4 - Hierarchy Selections
We set up the Selection Panel as shown below. In this example, we have used two row hierarchies, but you can use as many as needed.
STEP 5 - Configure Hierarchies
Now we use the Elements Panel to configure our hierarchies as shown in the table below.
| Hierarchy | Element Panel Setting |
| Columns/Promotions | All Promotions/Category |
| Columns/Measures |
Financials/Margins |
| Row/Month Dates | All Dates/Year |
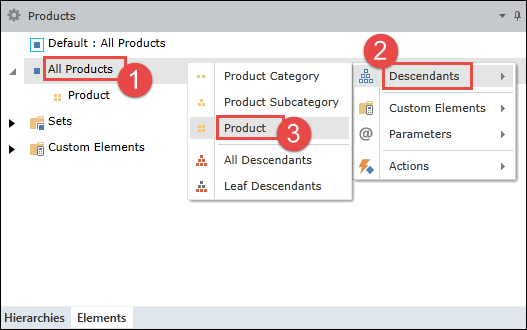
| Row/Products | All Products/Product |
Note that by using the "All" option, we allow as wide a search as possible through the database. For example, by selecting All Products/Product we ensure that the search is performed for all products in the database.
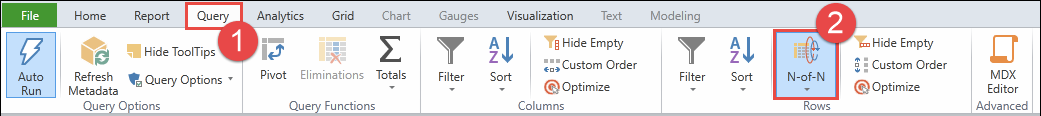
STEP 6 - Start N-of-N Wizard
- We open the Data Discovery/Query ribbon.
- We click on the N-of-N icon to open the wizard.
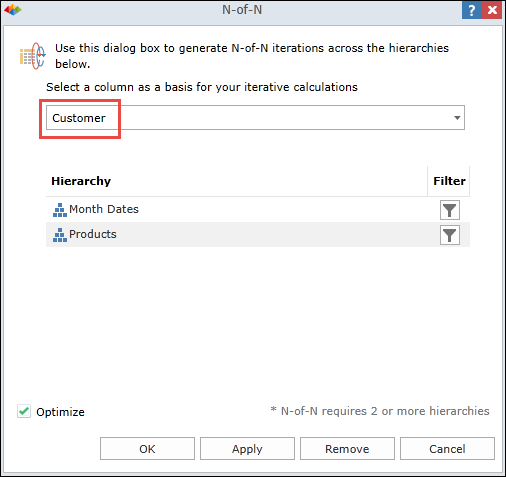
STEP 7 - Column Selection
We choose Customer as the column around which results are arranged. (In this case, "Customer" is one of three available categories: Customer, No Discount, Reseller.)
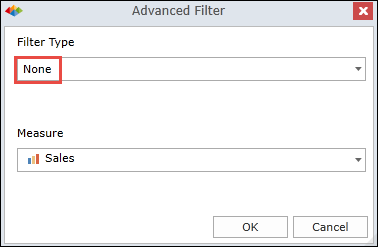
STEP 8 - Row Filter (Month Dates) 
For the Month Dates hierarchy:
- We click on the filter icon.
- We select a filter type of None.
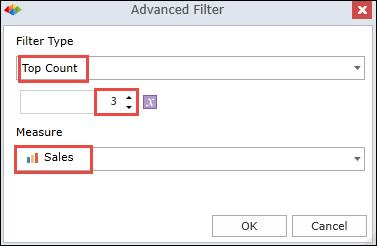
STEP 9 - Row Filter (Products)
For the Products hierarchy:
- We click on the filter icon.
- We select the Filter Type named "Top Count".
- We enter a Top Count of "3" indicating that we want the three top figures.
- We select the Measure named "Sales" to indicate we want to sort by sales margin in this nested loop.
NOTE: The purple icon ![]() can be used to insert a variable in this box. When using a variable, the variable value can be changed dynamically at runtime by the user.
can be used to insert a variable in this box. When using a variable, the variable value can be changed dynamically at runtime by the user.
STEP 10 - Run Query
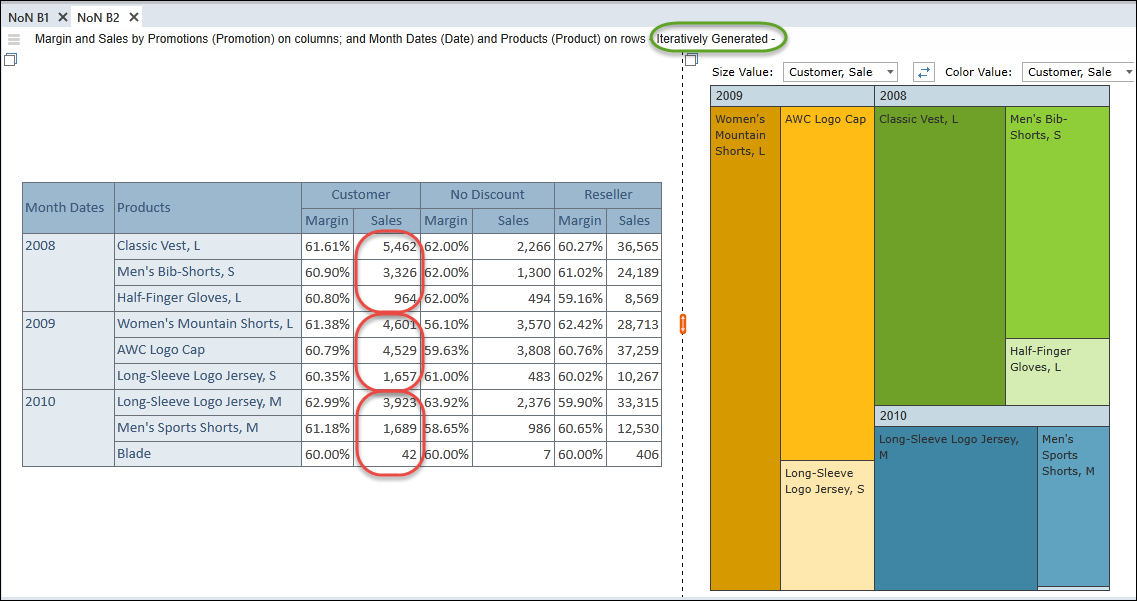
Now we are ready to click the Run Query button and perform N-of-N calculations in realtime. The results are shown below.
- For each year, the grid displays the top three selling products based on sales.
- The text "Iteratively Generated" appears in the report header (as shown below). This text is deleted from the report header if N-of-N functionality is removed from the report.
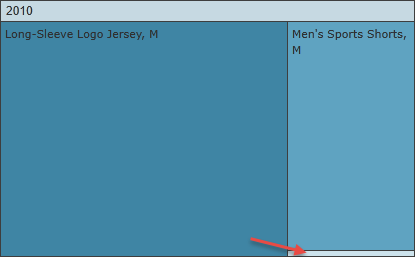
STEP 11 - Display Hidden Label
Note that the 2010/Blade value of 42 appears within a thin rectangle, but there is not enough room to display the label within the rectangle.
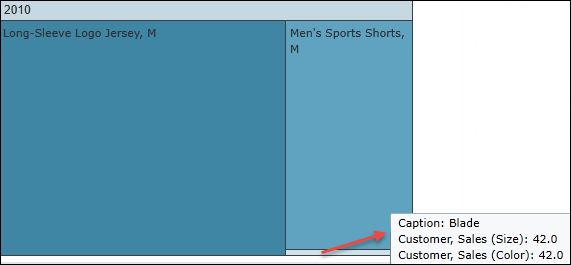
We can hover the mouse over the thin rectangle to display Blade information, as shown below.
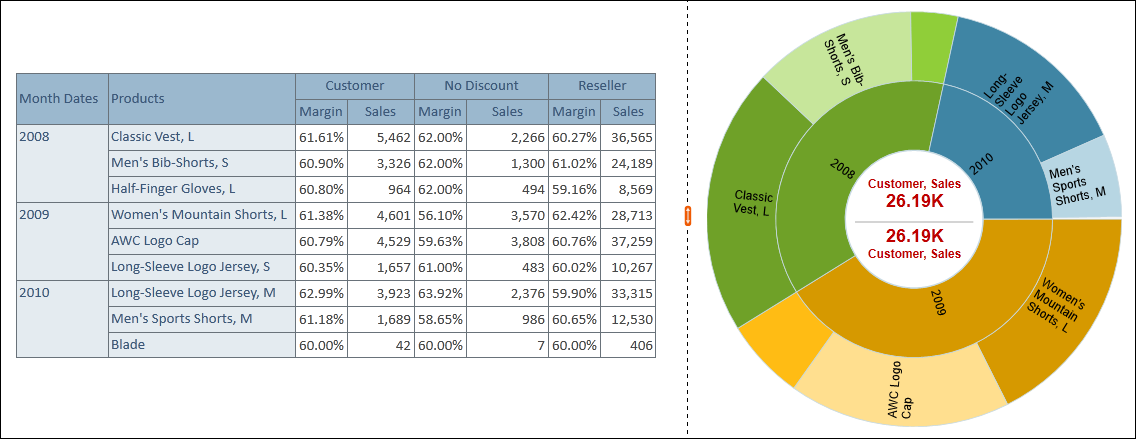
STEP 12 - Switch Visualization Type
To view the iteration data in a different format, we swap the Visualization type to Sunburst/Hierarchical and rerun the query. The results are shown below.
Home |
Table of Contents |
Index |
User Community
Pyramid Analytics © 2011-2022